The single hottest temperature on record for this region was 134°F in Death Valley, California on July 10, 1913; the coldest temperature on record was -80°F in Prospect Creek, Alaska on January 23, 1971.
The five Pacific Coast cities covered in this report are Barrow, Alaska; Bellingham, Washington; and Los Angeles, Red Bluff and San Diego, California.
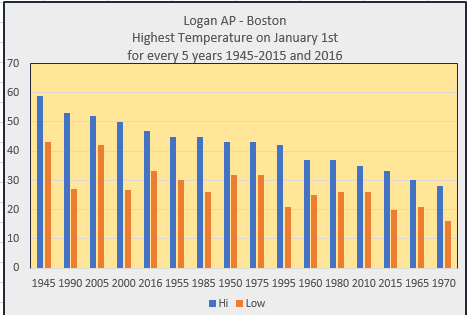
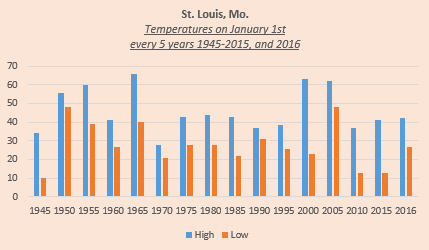
The Farmers Almanac website data collected by the National Climatic Data Center (NCDC), is the source for temperatures charted for the five cities above as recorded on January 1 every fifth year from 1945-2015, and January 1, 2016.
Barrow, AK is the U.S. northernmost city located 300-plus miles north of the Arctic Circle with a cold and dry, polar climate.

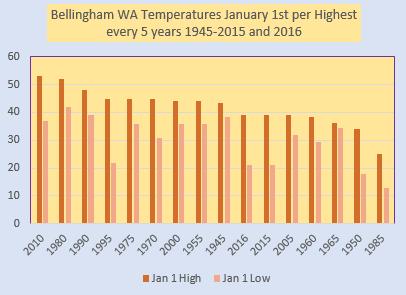
Bellingham, WA is the northernmost city in the Continental U.S.
National Oceanic and Atmospheric Administration (NOAA) reported that based on nationwide average temperatures, 2016 was the second hottest year on record.
Readers looking at temperatures on January 1st in these two cities will note their highest (warmest) temperatures occurred in different years; i.e.,. 2005 for Barrow, and 2010 for Bellingham.
Conversely, Barrow’s lowest (coldest) New Year’s Day temperature was in 1975, whereas Bellingham’s was in 1985.
San Diego, CA is the USA’s southernmost city on the Pacific coast.

The warmest New Year’s day there was in 1990. January 1, 2016 ranks the sixth warmest. San Diego’s high temperature reached only 55.9°F in 1965, only slightly warmer than New Year’s Day low of 54°F in 1955.
Red Bluff in northern California is approximately 75 miles from the midpoint between Bellingham and San Diego.
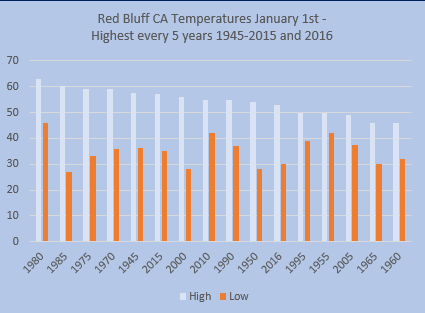
Its warmest January 1 was in 1980. The highest high, and the highest low temperatures were both greater than on any other New Year’s Day on the graph. In both 1960 and 1965, Red Bluff’s temperature on January 1 peaked at 46°F.
Al Gore raised concerns about global warming based on what he claimed were worldwide temperature spikes in 2005. However, Red Bluff’s New Year’s Day high that year was more than 10 degrees colder than 25 years earlier.
Los Angeles is the largest city on the west coast.

Like Red Bluff in northern California, Los Angeles experienced its warmest New Year’s Day in 1980 – a high of 71°F and a low of 52°F.
The coolest in Los Angeles on January 1 was 54°F, recorded in 1960, the same year Red Bluff had its coldest New Year’s Day temperature of 46°F, which was matched in 1965.
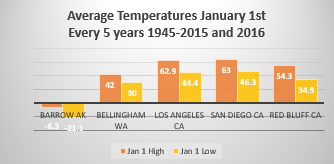
Averages vs Actuals
NOAA calculated that average U.S. temperatures in 2016 rose to 54.9°F, based on its data collected nationwide over several decades.
Yet, even from this small sampling it is interesting to compare “average” temperatures for the cities above with actual recorded temperatures on the New Year’s Days charted.
-
Barrow, AK: Actual “Highest” of 25°F is 31.3° warmer; Actual “Lowest” of -52.1°F is 31° colder.
-
Bellingham, WA: Actual “Highest” of 53.1°F is 11.1° warmer; Actual “Lowest” of 12.9°F is 17.1° colder.
-
Los Angeles, CA: Actual “Highest” of 71.1°F is 8.2° warmer; Actual “Lowest” of 36°F is 8.4° colder.
-
San Diego, CA: Actual “Highest” of 71.1°F is 8.1° warmer; Actual “Lowest” of 34.3°F is 12° colder.
-
Red Bluff, CA: Actual “Highest” of 63°F is 8.7° warmer; Actual “Lowest” of 27°F is 7.9° colder.
Differences between average and actual temperatures could influence decisions to be made about appropriate clothing for New Year’s Day activities, among others, when visiting a city away from home. Likewise, local residents need reliable information for planning the day’s activities.


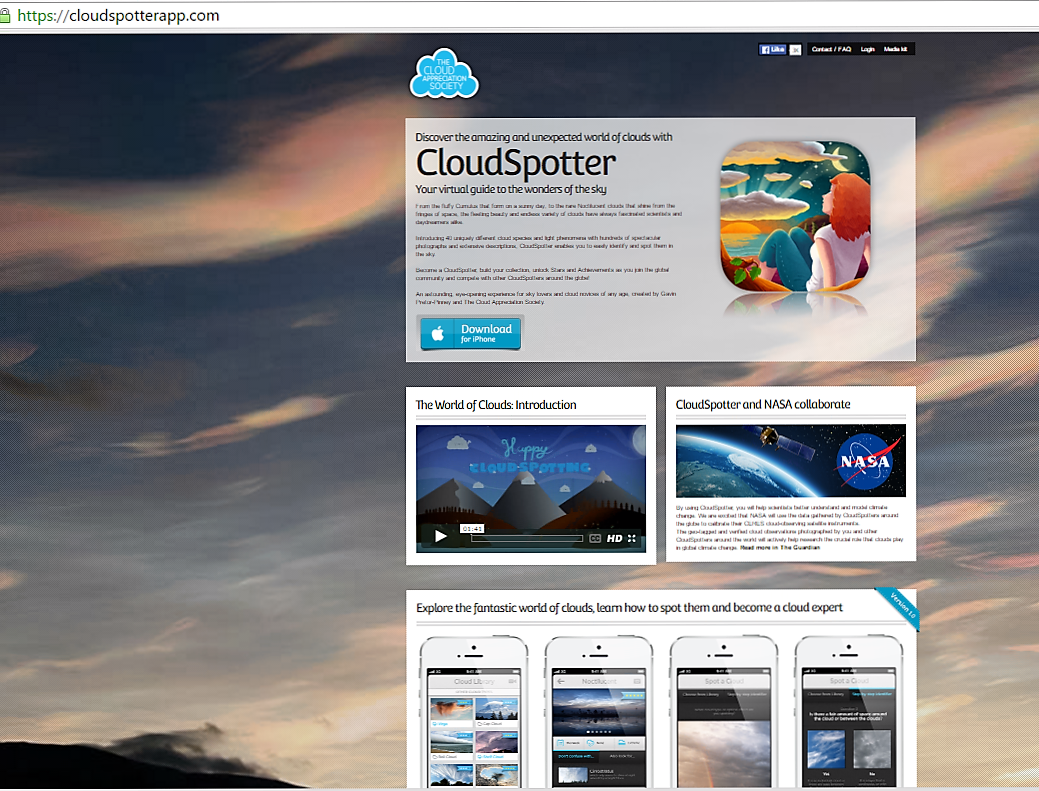 And to bring it all into the digital world, for only $2.99 iPhone owners can download the Society’s cloud-spotting app and explore 40 cloud types and submit photos.
 Pretor-Pinney also wrote the Cloud Collector’s Handbook, and as reported in June 2009 on NationalGeographic.com, has named what may be the first of a new type of cloud since 1951 – the